The Enterprise Leader’s Guide to AI Benchmarks in 2026
What each benchmark actually measures, where the scores stand, and how to use them in procurement.

TL;DR: Most AI benchmarks are saturated, contaminated, or gamed. The three that matter most for enterprise are SWE-bench (code), SimpleQA (hallucination rate), and BFCL (tool use). No single model wins everywhere — and model choice is probably the least important decision in your AI strategy.
Scroll to the Quick Reference Card at the bottom for a one-table cheat sheet.
Why this guide exists
AI benchmarks were supposed to make model selection straightforward: run standardized tests, compare scores, pick the winner.
That’s not how it works. The benchmark field in early 2026 has four structural problems, and ignoring any of them means making procurement decisions on bad data.

Saturation. MMLU, HumanEval, and AIME 2025 have ceiling scores across frontier models. When every contender scores 89-94%, the benchmark stops discriminating. Stanford’s 2025 AI Index confirmed it: MMLU no longer separates frontier models from each other.
Contamination. StarCoder-7b scored 4.9x higher on leaked benchmark data versus clean data. ARC benchmarks showed 23.6% score inflation from training set overlap.
A February 2025 interdisciplinary review (arXiv 2502.06559) adds a systemic finding: only 9 of 30 major models publicly report train-test overlap — and every lab uses a different detection method. Cross-model comparison is fundamentally unreliable.
Gaming. Selective model submissions inflate leaderboard scores by up to 100 points. Labs submit their best variant to each benchmark, cherry-pick the ones where they lead, and bury the rest.
The data wall. Epoch AI predicts the industry will exhaust all high-quality human text on the internet by 2026-2028. When that happens, model training shifts to synthetic data — data generated by other models.
Early research shows this risks “model collapse,” where outputs become increasingly homogeneous and detached from real-world distributions. Benchmarks trained on today’s data may not predict tomorrow’s model behavior.
Benchmarks aren’t useless. But you need to know which ones carry signal and which are marketing material. This guide covers every major benchmark an enterprise buyer will encounter, rates each for enterprise relevance, and gives you a framework for using them in procurement and evaluation.
A word on price before we get into this
Model performance is converging. Model costs are collapsing. Both facts change how benchmarks should influence your decisions.
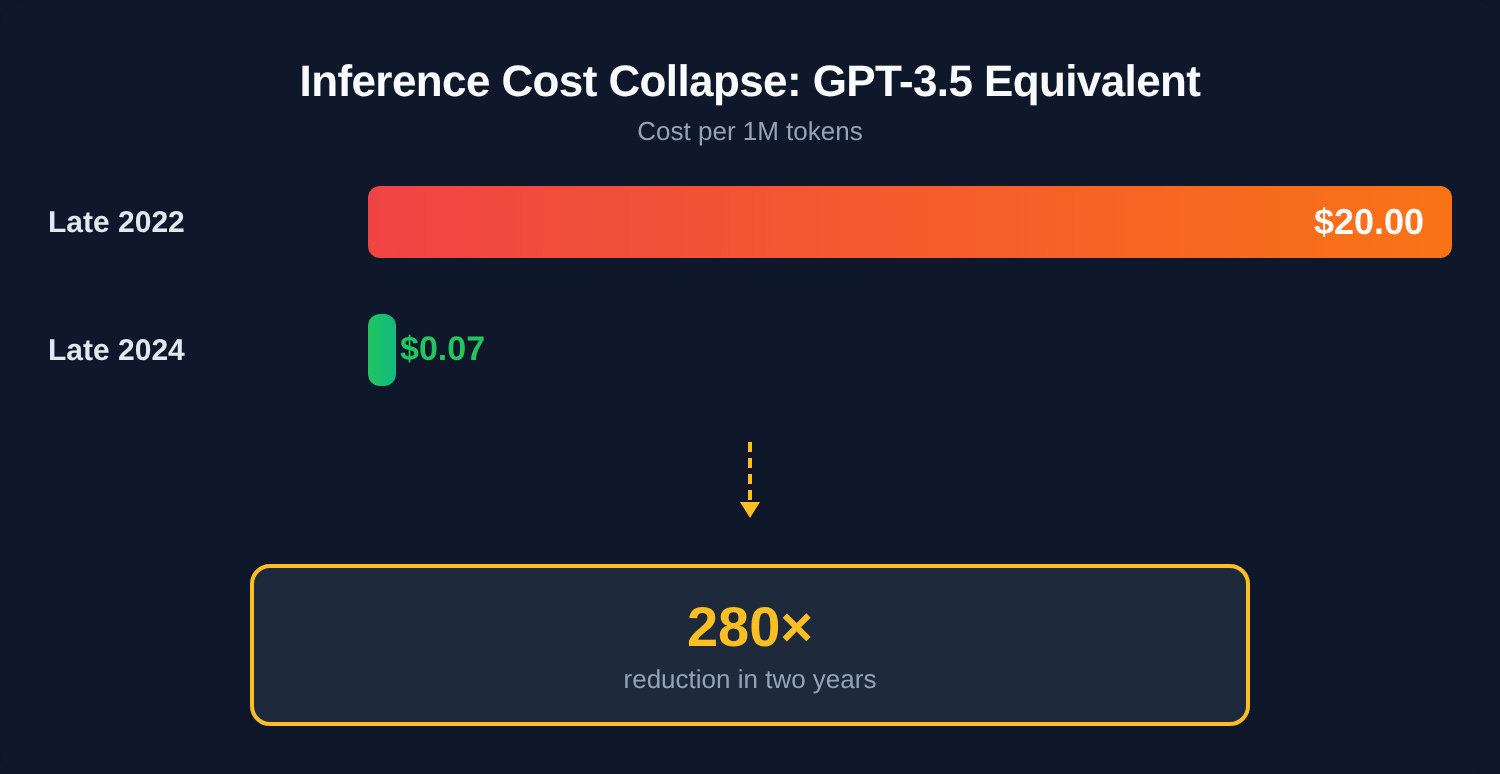
Inference cost collapse
The cost of running AI models has fallen faster than almost anyone predicted:
GPT-3.5 equivalent inference: $20.00 per million tokens (late 2022) to $0.07 per million tokens (late 2024) — a 280x reduction in two years.
Hardware efficiency: Energy efficiency per inference is improving roughly 40% year-over-year.
When inference was expensive, selecting the cheapest model that met your threshold made sense. When inference is nearly free, the question shifts: which model produces the fewest errors that require human correction?
A model that costs 3x more per token but halves your error rate will almost always win on overall cost. The old procurement question was “which model is cheapest per token?” The new one is “which model costs least per correct output?”
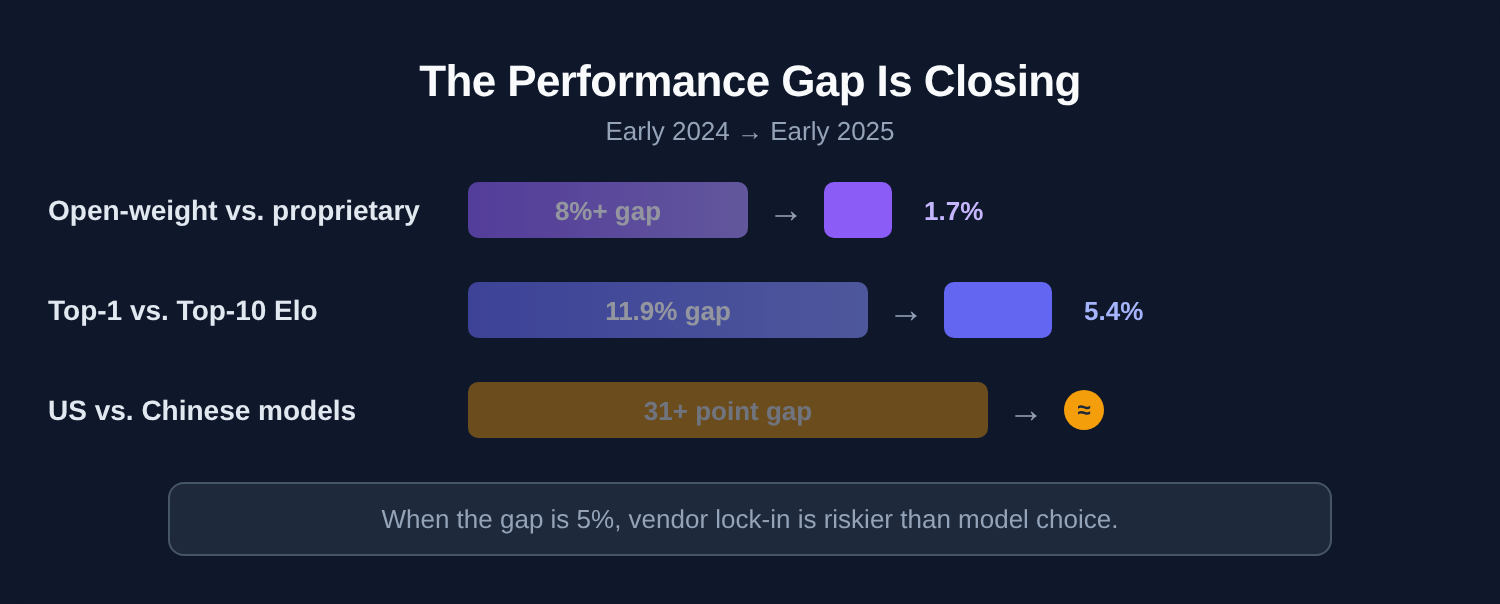
Model convergence
The performance gap between model tiers is narrowing fast:
Open-weight vs. proprietary gap: Over 8% in early 2024, down to 1.7% in early 2025.
Top-1 vs. Top-10 Elo gap: 11.9% to 5.4% in the same period.
US vs. Chinese model gap on HumanEval/MMLU: 31+ points to near parity.
When the performance delta between the best model and the tenth-best is 5%, vendor lock-in becomes riskier than model choice. Build for portability.
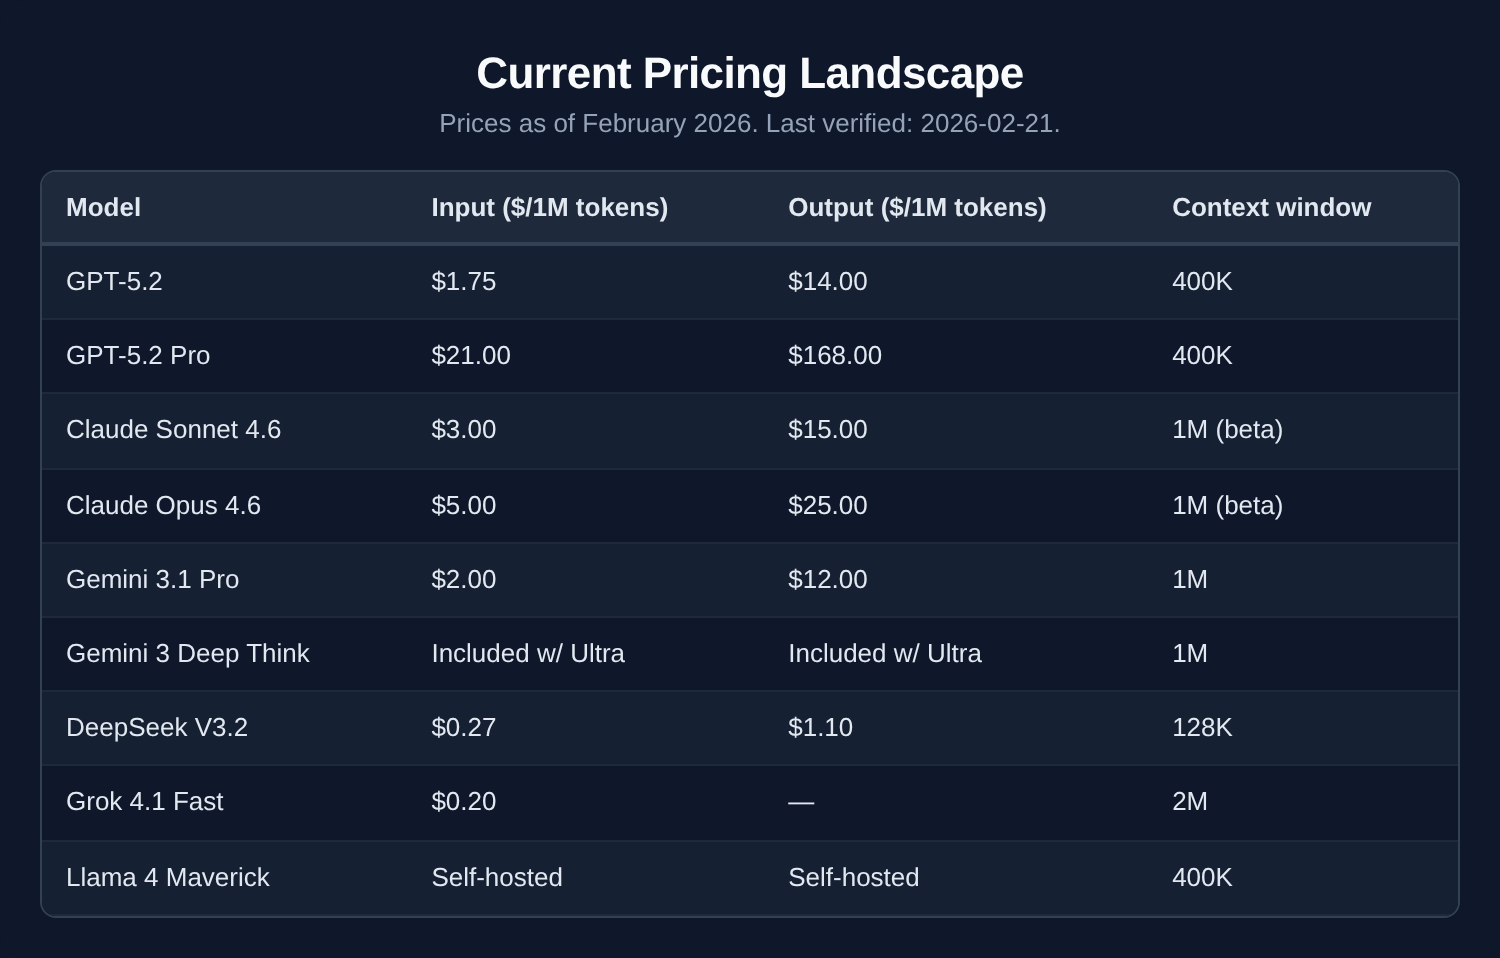
Current pricing landscape
Prices as of February 2026. Last verified: 2026-02-21.
The pricing story has flipped completely since 2024. The old premium-vs-budget calculus is gone.
Gemini 3.1 Pro (released February 19) matches or beats GPT-5.2 on several reasoning benchmarks at $2/M input versus $1.75/M.
DeepSeek V3.2 delivers roughly 90% of GPT-5.2’s performance at about 1/50th the cost.
Claude Opus 4.6 (released Feb 4) dropped from $15/M to $5/M while adding a 1M-token context window.
The meaningful price split now isn’t premium vs. mid-tier — it’s Western frontier vs. DeepSeek. If your data governance and compliance posture allows it, DeepSeek V3.2 at $0.27/M changes the math on almost every high-volume workload. If it doesn’t, Gemini 3.1 Pro is the best value in the Western tier.
For 80% of enterprise workloads, the mid-tier model is still the right call — it’s just that mid-tier is now dramatically cheaper and more capable than it was 12 months ago.
What the benchmarks actually tell us
Enterprises consistently focus on the wrong benchmarks. Here’s what matters for actual business decisions.
General-purpose benchmarks
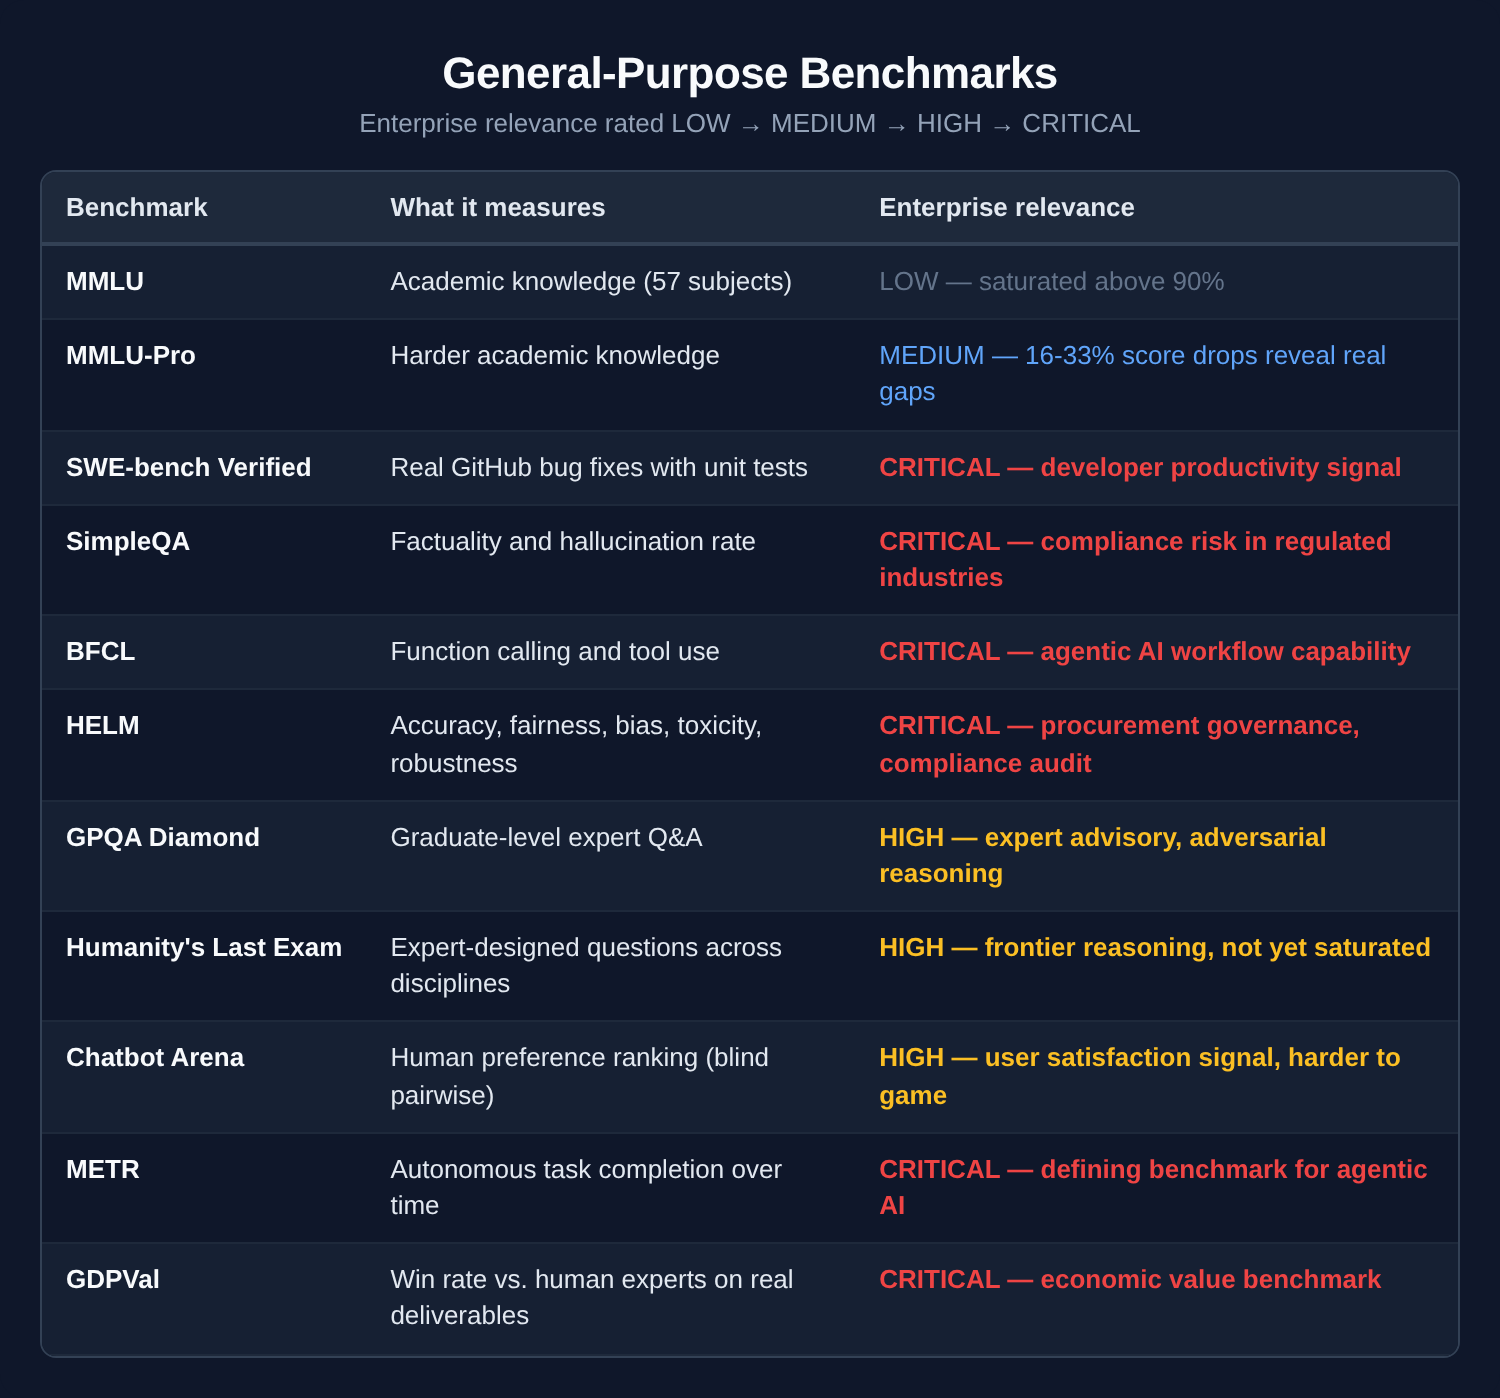
The benchmarks that matter most for enterprise are the ones you’ll never see in a vendor pitch deck. SWE-bench tells you whether a model can actually fix real code. SimpleQA tells you how often it hallucinates — the single most important metric for any regulated industry. BFCL measures whether a model can call tools and chain actions, which is the foundation of every agentic workflow your organization will build in the next two years.
MMLU, the number you’ll see most often, tells you almost nothing.
METR measures how long a task an AI agent can reliably finish without human help — real-world autonomy, not exam performance. The metric is the human expert task duration at which the model succeeds 50% of the time.
GDPVal evaluates AI output against human expert output head to head across 44 professional occupations and 9 industries. It measures whether AI can actually do jobs, not just answer questions about them.
Agentic AI benchmarks
BFCL and METR measure whether a model can use tools and complete tasks. This category goes further — it puts agents inside real operating environments and measures whether they can navigate the messy, multi-step reality of actual computer use, customer interactions, and enterprise API chains. These are the benchmarks that matter if you’re building anything autonomous.
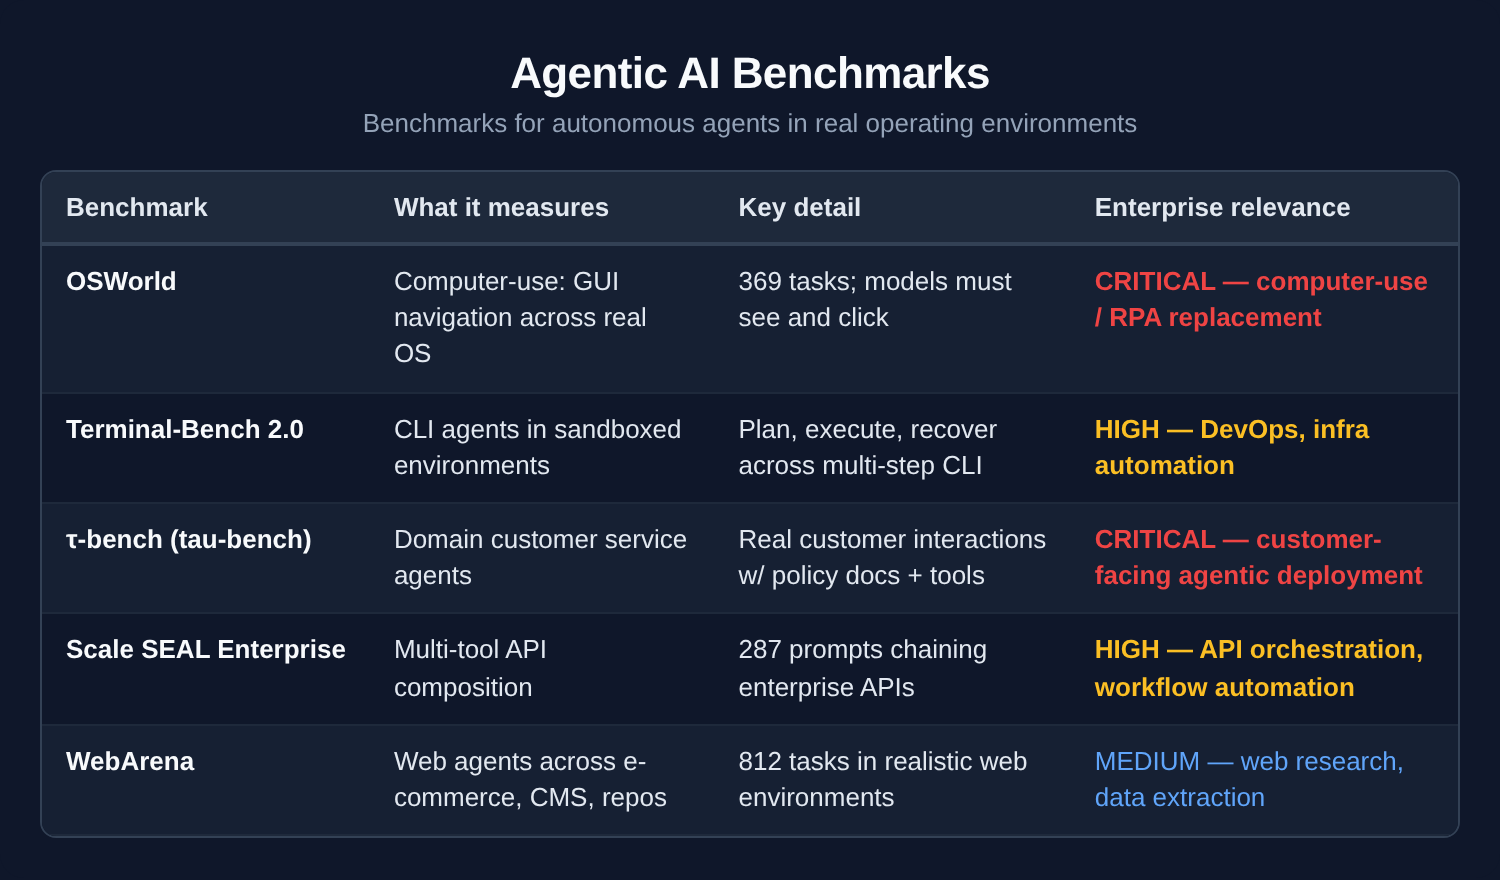
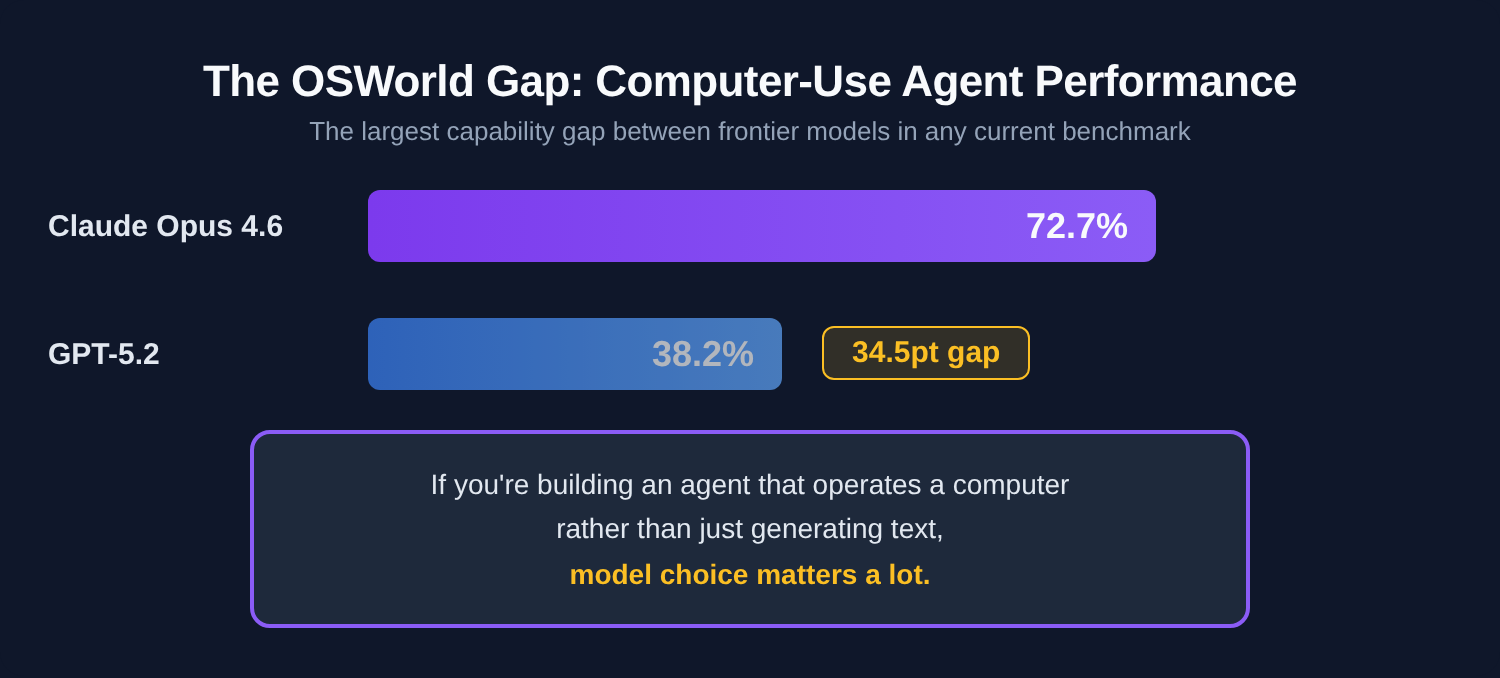
The OSWorld gap is the biggest story in agentic benchmarking right now. Claude Opus 4.6 scores 72.7% on OSWorld — computer-use tasks requiring real GUI navigation across apps and browsers. GPT-5.2 scores 38.2% on the same benchmark. That’s not a rounding error. It means if you’re building an agent that operates a computer rather than just generating text, model choice matters a lot more than the frontier snapshot table suggests.
τ-bench reveals a different truth. Claude Opus 4.6 hits 91.9% on the Retail scenario — meaning agents can handle the overwhelming majority of real customer service interactions without escalation. That’s deployable. Most enterprise leaders evaluating AI for customer ops are still running pilots based on chatbot demos. τ-bench is the eval that tells you whether you can actually put it in production.
So who’s actually winning? It depends entirely on what you’re measuring.
Frontier model performance snapshot (February 2026)
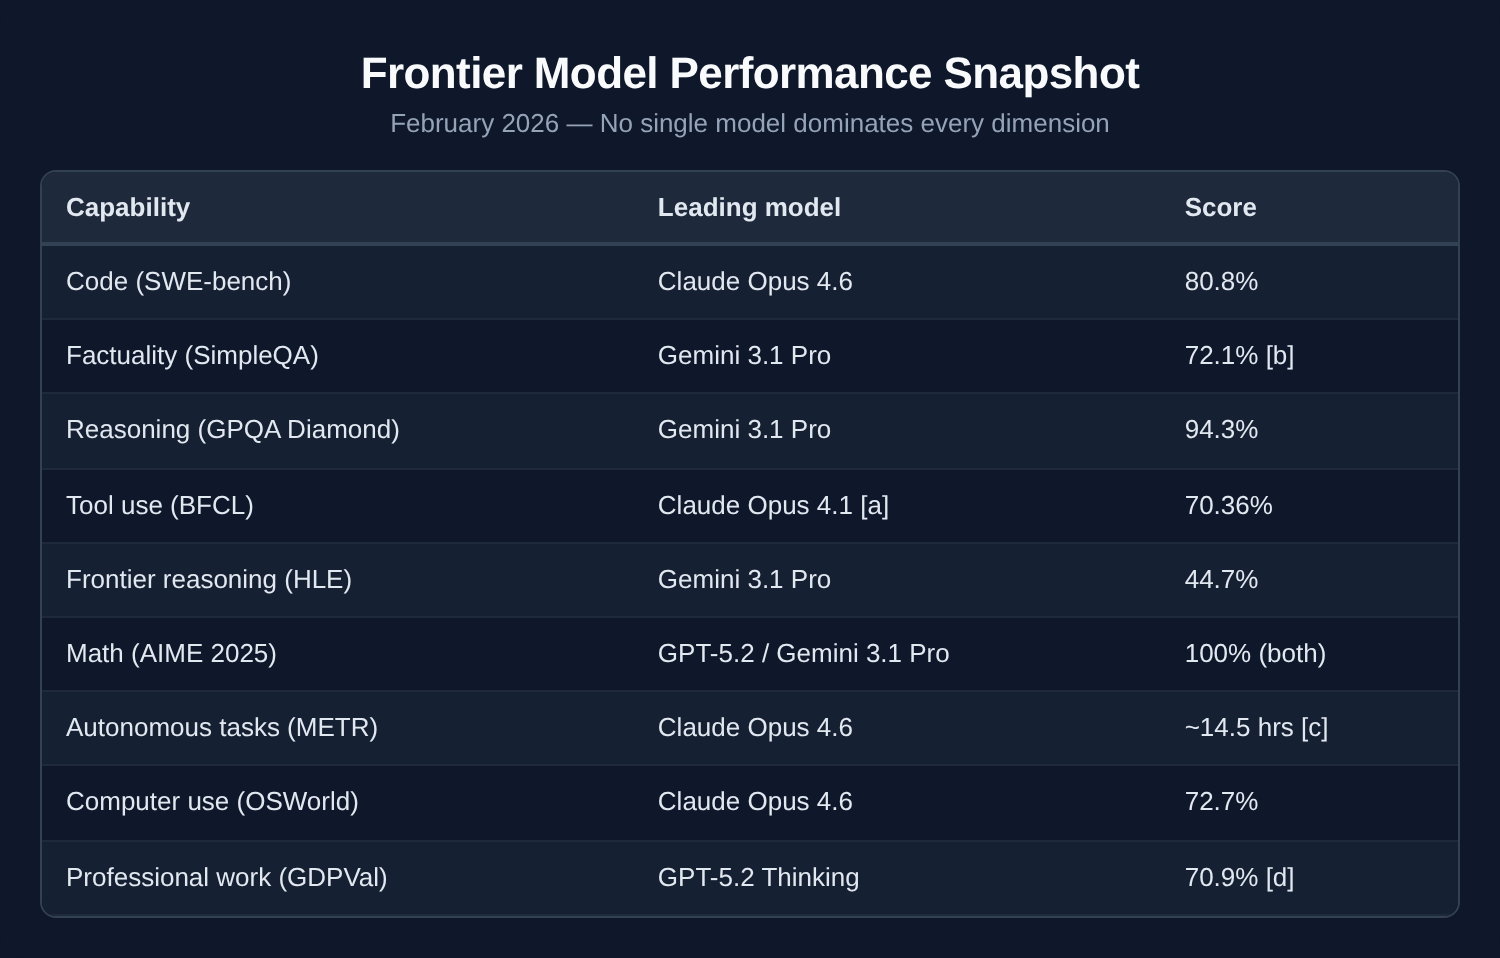
No single model dominates every dimension. Gemini 3.1 Pro leads on reasoning and factuality. Claude leads on code, computer use, and agentic tasks — the 72.7% vs 38.2% OSWorld split between Claude Opus 4.6 and GPT-5.2 is the largest capability gap between frontier models in any current benchmark. GPT-5.2 leads on professional work quality (GDPVal) and math.
The right model for your organization depends entirely on what you’re building — and that’s a question no leaderboard can answer for you.
Notes on the snapshot table:
[a] BFCL score reflects Claude Opus 4.1, the most recent Claude submission to the leaderboard at time of publication. Opus 4.6 has not yet been formally benchmarked on BFCL.
[b] SimpleQA score of 72.1% is confirmed for Gemini 3 Pro (released November 2025); Gemini 3.1 Pro leads on factuality across available evaluations but a formally published 3.1 Pro score was not available at time of publication. Verify against Google DeepMind’s current benchmark data.
[c] METR time horizon estimate for Claude Opus 4.6 (~14.5 hrs) is preliminary and noted as high-variance by METR. Gemini 3.1 Pro clocks ~11 hrs at the same threshold. The metric measures human expert task duration at which the model succeeds 50% of the time — a fundamentally different signal than accuracy scores.
[d] GDPVal scores: Claude Opus 4.5 at 59.6%, Gemini 3 Pro at 53.5% win-or-tie rate vs. human experts. GDPval-AA Elo (Artificial Analysis agentic version): Claude Sonnet 4.6 leads at 1633, Claude Opus 4.6 at 1606.
General benchmarks give you a starting point. But if you’re in financial services, they’re not enough.
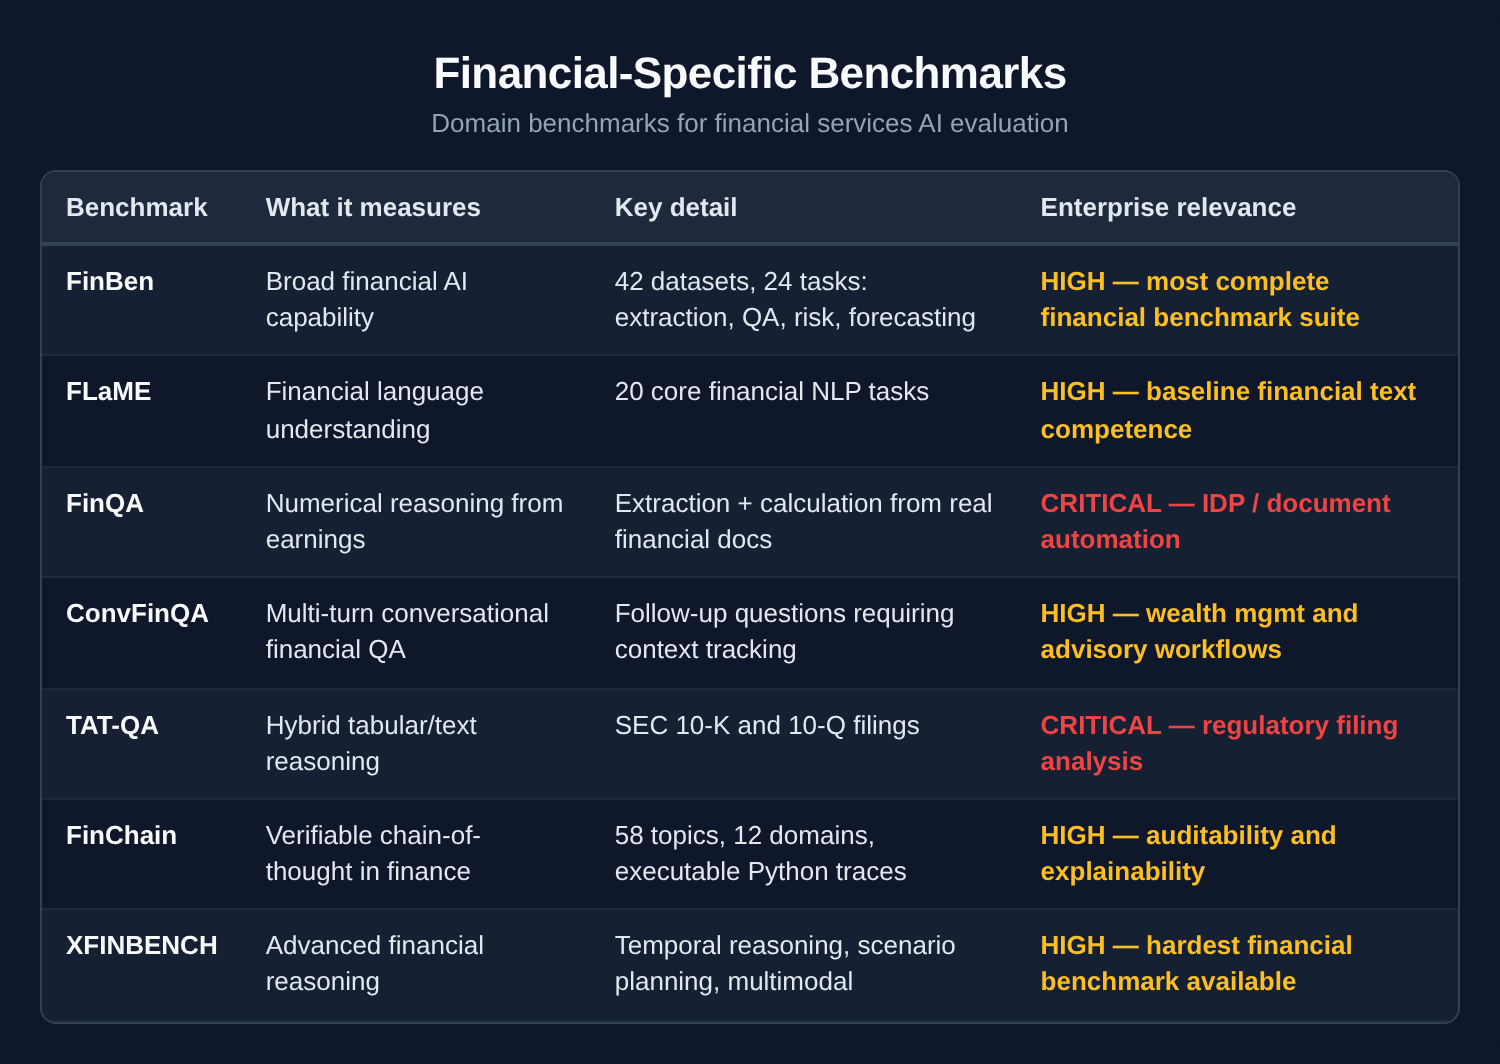
Financial-specific benchmarks
General benchmarks are insufficient for financial services. The real question is whether a model can handle the specific reasoning that financial work demands: numerical extraction from dense filings, multi-step calculations with verifiable logic, temporal reasoning across reporting periods, and regulatory interpretation.
A new class of domain-specific benchmarks has emerged. Most enterprise leaders haven’t encountered them yet.
The TAT-QA reality check
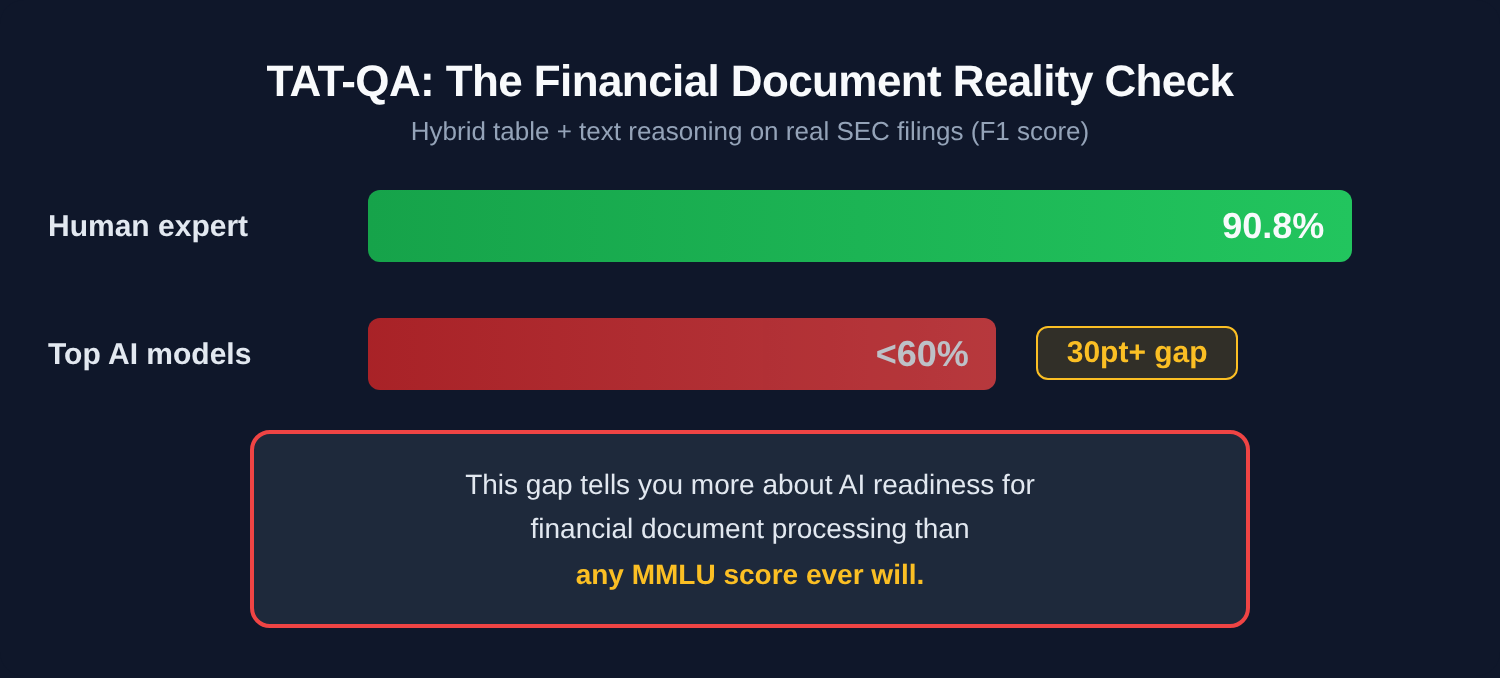
Here’s the number that should make your procurement team uncomfortable: TAT-QA tests models on real SEC filings where the answer requires combining information from tables and surrounding text — exactly what financial analysts do every day. Human expert F1 score: 90.8%. At publication, top models struggled below 60% — current frontier models score higher, but the human gap remains significant. That gap tells you more about AI readiness for financial document processing than any MMLU score ever will.
XFINBENCH scores
Note: XFINBENCH is an academic benchmark; formal evaluations of current frontier models (GPT-5.2, Claude Opus 4.6, Gemini 3.1 Pro) haven’t been published yet. Scores below are from the original paper — treat them as a baseline for the human gap, not a current model ranking.
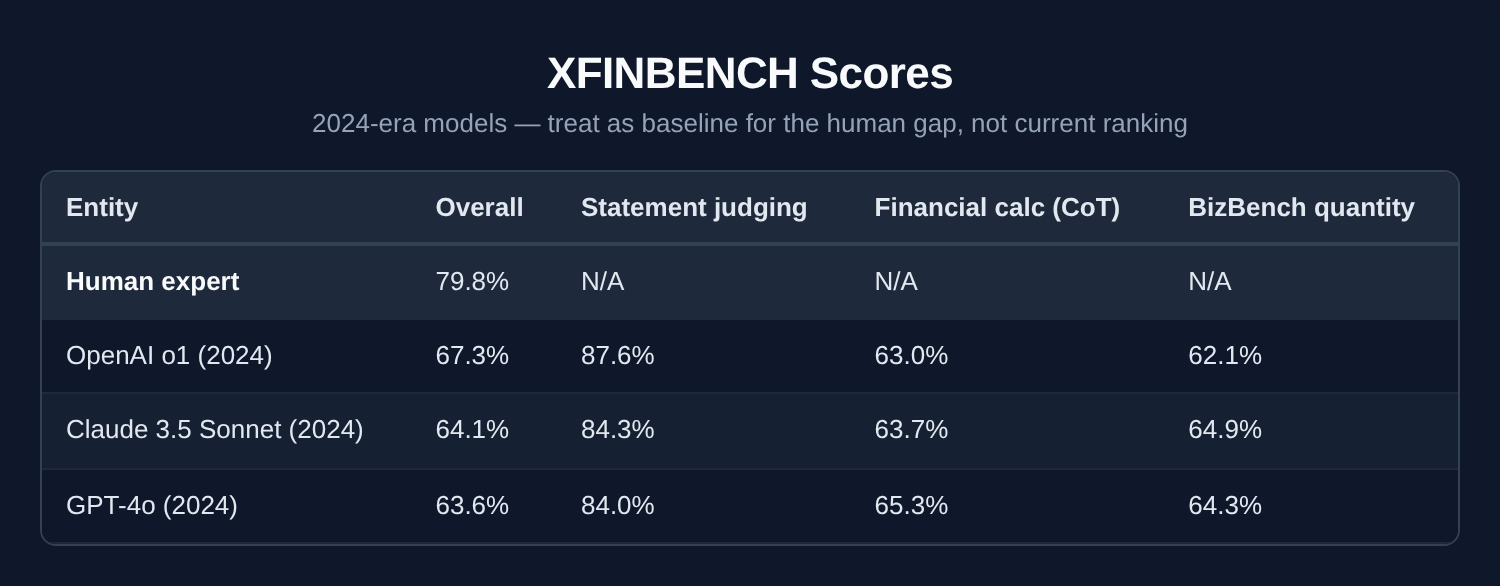
Human experts still outperform those 2024-era models by 12+ points on overall financial reasoning. Current frontier models will score higher — but the pattern that matters is unlikely to change: statement judging approaches human performance, quantitative reasoning does not. Model selection matters far less than whether your workflow can handle the cases the model gets wrong.
Models can tell you if a financial statement is wrong. They can’t reliably do the math to prove it. Statement judging — is this financial claim true or false? — is the one area where models approach human performance. Quantitative reasoning, the thing that actually matters for trading, risk, and compliance, is where they struggle.
Use case mapping
Here’s how to connect benchmarks to the enterprise functions where AI is creating real value in financial services.
Algorithmic trading and quantitative research
Relevant benchmarks: SWE-bench Verified (code reliability), XFINBENCH (financial calculation with chain-of-thought), FinChain (verifiable reasoning traces).
Can the model generate trading logic with auditable reasoning? Can it maintain accuracy across multi-step calculations? Agentic AI in payments is already routing decisions in under 200ms. The threshold here isn’t accuracy in isolation — it’s latency-adjusted accuracy. FinChain’s executable Python traces give you something the other benchmarks don’t: a verifiable audit trail from input to output — which is increasingly a regulatory expectation, not just a nice-to-have.
Risk and fraud detection
Relevant benchmarks: GPQA Diamond (adversarial reasoning), HLE (frontier reasoning under uncertainty), HELM (robustness and bias evaluation).
Adversarial robustness matters more than raw accuracy. A fraud detection model that scores 95% but fails predictably on adversarial inputs is worse than one that scores 90% with graceful degradation. Fraud detection is the top AI use case across financial services respondents (NVIDIA, 2026). The question is whether their evaluation framework catches the failure modes that matter.
Intelligent document processing
Relevant benchmarks: TAT-QA (hybrid table/text from SEC filings), FinQA (numerical extraction from earnings), DocVQA (document visual QA).
Test against real financial documents with mixed tables and narrative text. If a model can’t outperform 60% F1 on TAT-QA, it’s not ready for production document processing without heavy human oversight. Period. DocVQA adds a visual layer — can the model parse scanned documents, not just clean text? For organizations still processing paper-heavy workflows, this is the benchmark that predicts real throughput improvement.
Wealth management and advisory
Relevant benchmarks: ConvFinQA (multi-turn financial dialogue), Chatbot Arena (human preference in conversation), FLaME (financial language fluency).
Can the model maintain financial accuracy across a multi-turn conversation? Can it correct its own errors when challenged? A model that gives a perfect single answer but loses context on follow-up questions will frustrate advisors within a week.
Agentic workflows (cross-functional)
Relevant benchmarks: BFCL (function calling), SWE-bench Verified (code execution), SimpleQA (factual grounding), METR (task autonomy), OSWorld (computer use), τ-bench (domain agents), Scale SEAL Agentic Tool Use Enterprise (API chains).
A significant share of financial industry respondents are already using or assessing agentic frameworks, with agentic AI ranking among the fastest-growing use case categories (NVIDIA, 2026). The evaluation stack for agentic systems has three layers — and most organizations are only looking at the first one.
Layer 1 — Tool calling. BFCL: can the model call the right API, with the right parameters, at the right time? A 70% BFCL score means 30% of tool calls fail. For autonomous agentic systems, that failure rate requires robust fallback design, not just monitoring.
Layer 2 — Real environment operation. OSWorld and Terminal-Bench measure whether an agent can actually navigate a computer, not just generate instructions about it. Claude Opus 4.6 at 72.7% on OSWorld versus GPT-5.2 at 38.2% is the kind of gap that determines whether your computer-use agent ships or sits in a demo. τ-bench (tau-bench) tests agents inside domain-specific customer service scenarios with real policy documents and tool calls — Claude hits 91.9% on the Retail scenario.
Layer 3 — Autonomous task completion. METR’s time horizon asks: how long a task can the model complete without human intervention? Claude Opus 4.6 at ~14.5 hours means it can reliably handle tasks that would take a human expert most of a workday. That number has been doubling every 7 months for six years. The METR score tells you how much human oversight your agentic workflows actually need — which is a design question no accuracy benchmark can answer. The philosophical divide between Microsoft and Anthropic on this is worth understanding before you architect your stack.
The explainability trade-off
Reasoning models — o3, GPT-5.2 Thinking, Gemini Deep Think, models that “think” before answering — are measurably more capable. They score higher on GPQA Diamond, XFINBENCH, and other reasoning-heavy benchmarks. They’re also more opaque. The chain-of-thought that makes them powerful makes them harder to explain to a regulator.
For regulated industries, this creates a direct conflict between performance and compliance. The best-performing model may not be the one you can deploy.
Decoupling generation from execution
The practical answer: decouple AI generation from deterministic execution. Let the model reason and recommend. Have deterministic systems validate the output before it touches a customer, a trade, or a filing. Benchmark the model on accuracy. Benchmark the system on reliability. They’re different questions with different acceptable failure rates.
The measurement problem
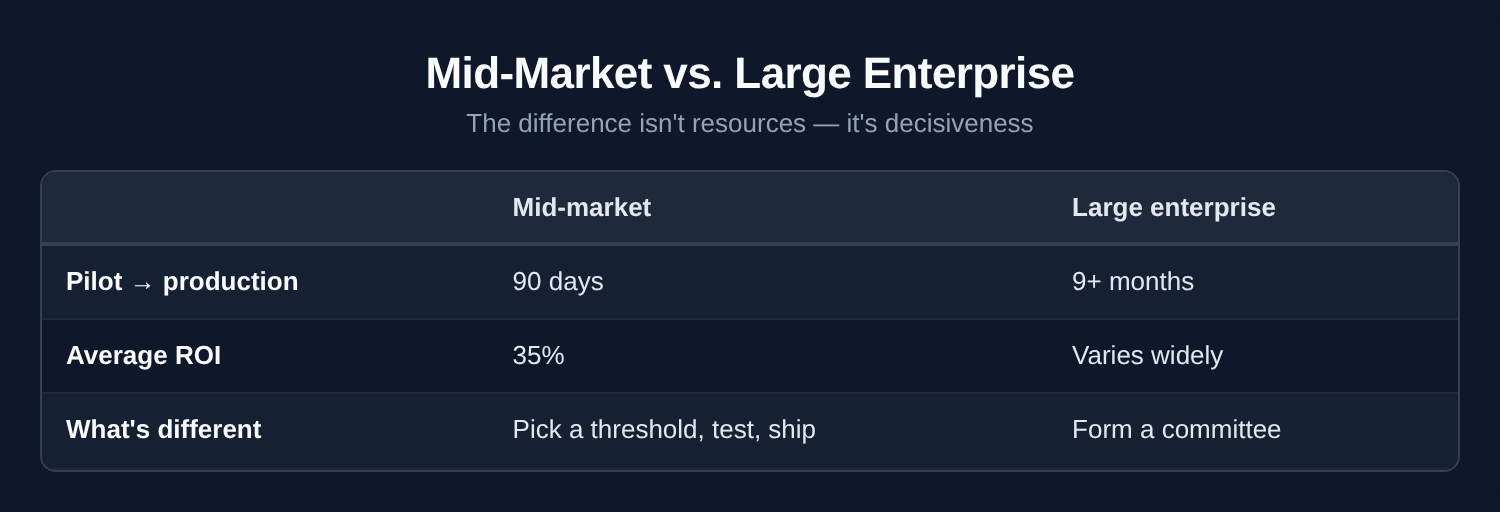
Eighty-eight percent of organizations are now using AI — and nearly two-thirds can’t get past the pilot stage. That’s not a model problem. It’s a measurement problem — and more often than not, a skills problem.
80% of AI value comes from redesigning the work, not picking a better model. The delta between a 90% MMLU score and a 92% score will never matter as much as whether you’ve redesigned the workflow around the AI or bolted it onto the existing one. Individual workers are already figuring this out — the gap is at the organizational level.
Organizations with structured ROI measurement frameworks report 5.2x higher confidence in their AI investments (Second Talent, 2026). Ninety-two percent of early technology adopters report positive ROI, with average returns of 192%. The common factor isn’t which model they picked. It’s that they built measurement into the deployment from day one. The ones still struggling aren’t lacking tools — they’re lacking the internal capability to use them.
Mid-market Large enterprise Pilot → production 90 days 9+ months Average ROI 35% Varies widely What’s different Pick a threshold, test, ship Form a committee
Sapphire Ventures predicts that by 2026, enterprise evaluations will move toward private, grounded benchmarks built on proprietary data that reflect actual business processes. Your data quality, workflow integration, and measurement discipline will drive differentiation — not a two-point lead on a public leaderboard.
What to do with this
The model choice is probably the least consequential decision in your AI strategy. Work redesign, data quality, integration depth, and measurement discipline will determine 80% of the outcome.
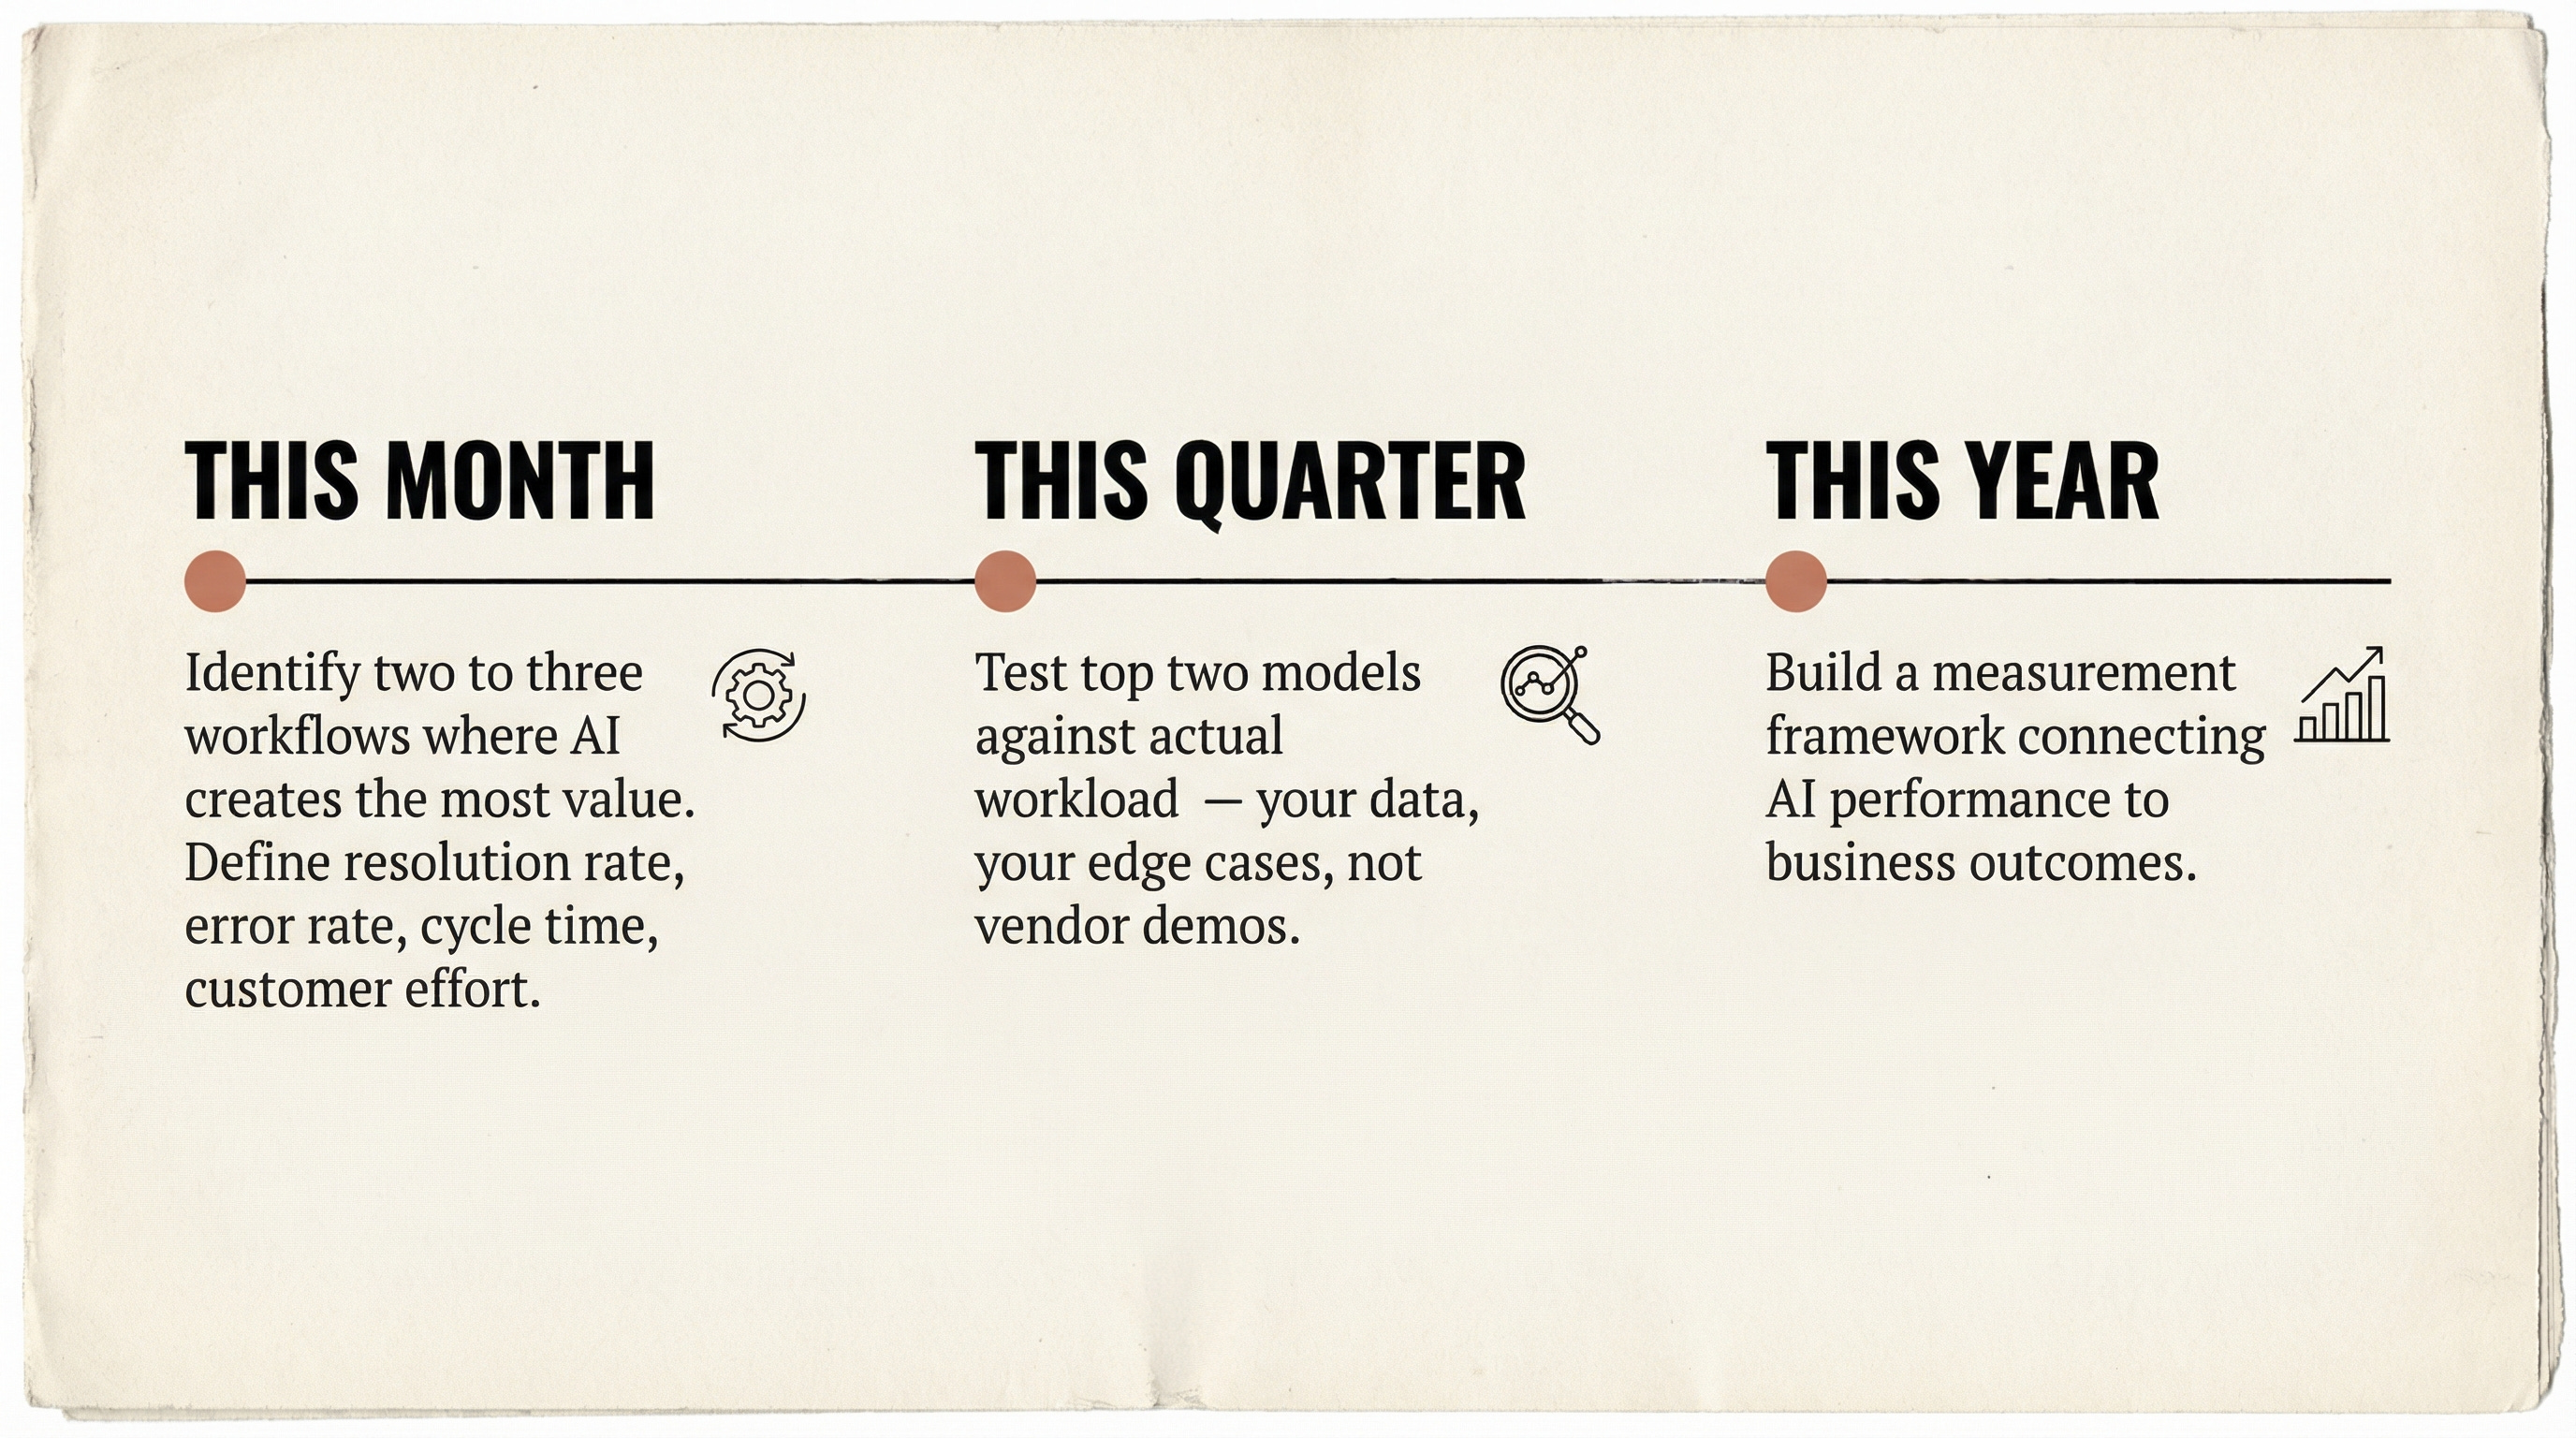
Do this now. Identify the three to five workflows where AI creates the most value in your organization. For each one, define what “good” looks like in terms your business cares about: resolution rate, error rate, cycle time, customer effort. These are your private benchmarks.
Before the end of Q1, run your top two model candidates against your actual workload. Not a vendor demo. Not a public benchmark. Your data, your edge cases, your failure modes. The results will look nothing like the leaderboard — that’s the point. Given model convergence, also test whether you can swap models without rebuilding your pipeline. The ability to swap is not a nice-to-have — because if you’re locked into one vendor and they raise prices or get outcompeted, you’re stuck rebuilding from scratch.
If you’re building anything in financial services, stop evaluating against MMLU. Map your use cases to TAT-QA, FinQA, and XFINBENCH. The domain-specific benchmarks above exist precisely because general benchmarks don’t predict financial task performance.
If you’re in a regulated industry, start aligning your AI evaluation process with the US Treasury FS AI RMF now. Don’t wait for OSFI E-23 to take effect in May 2027. The organizations that treat regulatory compliance as a design constraint rather than an afterthought will move faster, not slower — because they won’t be rebuilding governance frameworks under deadline pressure.
Build your own benchmark. GDPVal points the direction. OpenAI built it by asking what actual knowledge workers produce — legal briefs, engineering blueprints, care plans — and measuring AI output against human expert output head to head. GPT-5.2 Thinking wins or ties against human experts 70.9% of the time across 44 professional occupations. That’s the kind of measurement that translates to a hiring or workflow decision. Take your five highest-volume, highest-stakes work products and run your model candidates against them. That’s your benchmark. Everything else is someone else’s leaderboard.
The labs are optimizing for the leaderboard. You should be optimizing for your customers. Those are different problems.
A note on the numbers: Benchmark scores, pricing, and adoption statistics in this article are drawn from publicly available sources and reflect information available at time of publication (February 2026). The AI landscape moves fast — specific scores may have shifted, pricing will have changed, and some benchmarks cited here may already be saturated or superseded. The figures are illustrative of broader patterns and directional trends, not precision instruments. Verify against current vendor documentation and primary sources before making procurement decisions.
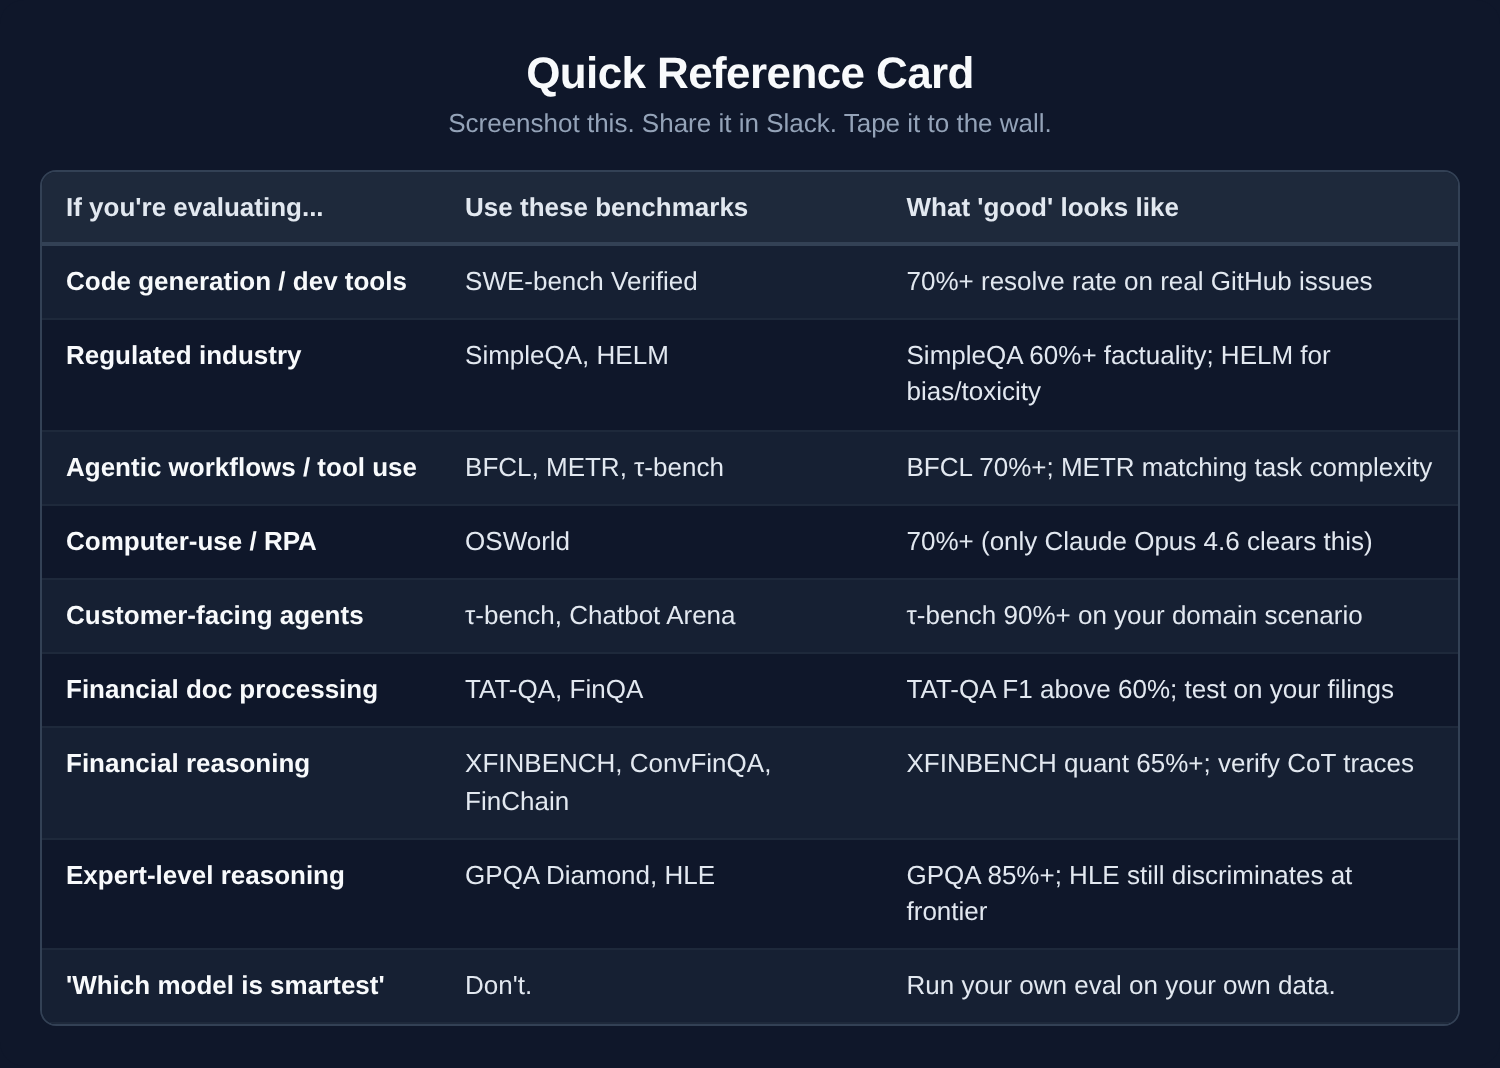
Quick Reference Card
Screenshot this. Share it in Slack. Tape it to the wall next to the vendor pitch deck.